

Part A: Getting statistics#
We run the heat equation from Step 2 again, now for eight time steps, and look at what the controller returns besides the solution: the statistics. pySDC records residuals, iteration counts, timings and more while it runs, and this is how we find out what happened.
import matplotlib.pyplot as plt
import numpy as np

from pySDC.helpers.stats_helper import get_list_of_types, get_sorted
from pySDC.implementations.controller_classes.controller_nonMPI import controller_nonMPI
from pySDC.implementations.problem_classes.HeatEquation_ND_FD import heatNd_forced
from pySDC.implementations.sweeper_classes.imex_1st_order import imex_1st_order

# initialize level parameters
level_params = {'restol': 1e-10, 'dt': 0.1}

# initialize sweeper parameters
sweeper_params = {'quad_type': 'RADAU-RIGHT', 'num_nodes': 3}

# initialize problem parameters
problem_params = {
    'nu': 0.1,  # diffusion coefficient
    'freq': 4,  # frequency for the test value
    'nvars': 1023,  # number of degrees of freedom
    'bc': 'dirichlet-zero',  # boundary conditions
}

# initialize step parameters
step_params = {'maxiter': 20}

# initialize controller parameters (<-- this is new!)
controller_params = {'logger_level': 30}  # reduce verbosity of each run

# Fill description dictionary for easy hierarchy creation
description = {
    'problem_class': heatNd_forced,
    'problem_params': problem_params,
    'sweeper_class': imex_1st_order,
    'sweeper_params': sweeper_params,
    'level_params': level_params,
    'step_params': step_params,
}

# instantiate the controller
controller = controller_nonMPI(num_procs=1, controller_params=controller_params, description=description)

# set time parameters
t0 = 0.1
Tend = 0.9

# get initial values on finest level
P = controller.MS[0].levels[0].prob
uinit = P.u_exact(t0)

# call main function to get things done...
uend, stats = controller.run(u0=uinit, t0=t0, Tend=Tend)
The controller parameter logger_level controls how much the run prints. It takes the
levels of Python’s logging module: 20 (INFO,
the default) shows every iteration, 30 (WARNING) only what goes wrong. That is why this run was silent.
What is in stats#
stats is a dictionary. Each value is one number, and its key says where and when that number was recorded:
key = next(iter(stats))
print(f'{len(stats)} entries, for example')
print(f'  key:   {key}')
print(f'  value: {stats[key]}')
523 entries, for example
  key:   Entry(process=0, process_sweeper=0, time=0.1, level=0, iter=1, sweep=1, type='residual_post_sweep', num_restarts=0)
  value: 0.004111907556308629
The keys are tuples that record the process, the time, the level, the iteration, the sweep, the type of the
value and more, so every value carries a kind of time stamp. This makes stats a little complex, but it also
means that anyone can add their own entries without changing its definition, as we do in
Part B. Which types a run recorded, including those added by users, get_list_of_types
tells:
print('List of registered statistic types:', get_list_of_types(stats))
List of registered statistic types: ['residual_post_sweep', 'residual_post_iteration', 'niter', 'residual_post_step', '_recomputed', 'timing_setup', 'timing_comm', 'timing_sweep', 'timing_iteration', 'timing_step', 'timing_run', 'restart']
The entries are made by hooks, see the Hooks class in pySDC/core/hooks.py and the default ones in
pySDC/core/default_hook.py.
Filtering and sorting#
get_sorted picks the entries that match the keywords we give it, and returns them sorted by one field of the key,
as a list of tuples (value of that field, value). Here: all residuals recorded in the first time step, sorted by
iteration.
# filter statistics by first time interval and type (residual)
residuals = get_sorted(stats, time=0.1, type='residual_post_iteration', sortby='iter')

for item in residuals:
    print('Residual in iteration %2i: %8.4e' % item)
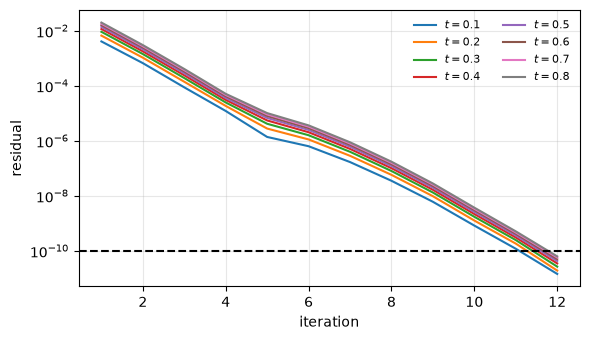
Residual in iteration  1: 4.1119e-03
Residual in iteration  2: 6.6844e-04
Residual in iteration  3: 8.8038e-05
Residual in iteration  4: 1.2171e-05
Residual in iteration  5: 1.3827e-06
Residual in iteration  6: 6.3645e-07
Residual in iteration  7: 1.6895e-07
Residual in iteration  8: 3.5259e-08
Residual in iteration  9: 6.0722e-09
Residual in iteration 10: 8.2716e-10
Residual in iteration 11: 1.1914e-10
Residual in iteration 12: 1.4455e-11
And the number of iterations for every time step, sorted by time. get_sorted is a shortcut for
sort_stats(filter_stats(...)), with the same arguments.
# get and convert filtered statistics to list of iterations count, sorted by time
iter_counts = get_sorted(stats, type='niter', sortby='time')

for item in iter_counts:
    print('Number of iterations at time %4.2f: %2i' % item)
Number of iterations at time 0.10: 12
Number of iterations at time 0.20: 12
Number of iterations at time 0.30: 12
Number of iterations at time 0.40: 12
Number of iterations at time 0.50: 12
Number of iterations at time 0.60: 12
Number of iterations at time 0.70: 12
Number of iterations at time 0.80: 12
Warning
Filtering compares exactly. The first step starts at t0 = 0.1, which is stored as given, but later times are
sums of time steps: the third step starts at 0.30000000000000004, so time=0.3 finds nothing. To pick a later
step, sort by time and compare with a tolerance instead:
print('filtered with time=0.3:', get_sorted(stats, time=0.3, type='niter'))
print('compared with np.isclose:', [item for item in iter_counts if np.isclose(item[0], 0.3)])
filtered with time=0.3: []
compared with np.isclose: [(0.30000000000000004, 12)]
With a little more filtering we can see all eight steps converge the same way:
Summary#
The controller returns
stats, a dictionary whose keys record where and when each value was taken.get_list_of_typesshows what is in there;get_sortedfilters and sorts it.Filter by time only with times you did not compute; otherwise, compare with a tolerance.
The check the tests run:
assert all(item[1] == 12 for item in iter_counts), f'ERROR: number of iterations are not as expected, got {iter_counts}'